Computer-aided inspection of parts and toolsDeviation Analysis
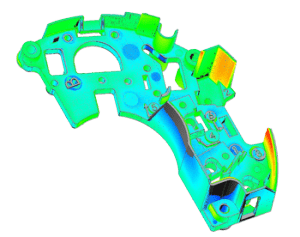
Deviation Analysis is a method of inspection that compares 3D scan data to existing CAD or other scan data.
Deviation Analysis is an extremely cost-effective way to capture near full-coverage of any part and compare it to a known standard.
The deliverable of a Deviation Analysis project can also be referred to as a Comparative Analysis, Computer Aided Inspection (CAI), Computer Aided Verification (CAV), or Color Maps. Point cloud data is overlaid to an existing CAD model or scan data of another part to show deviation. Used for rapid design verification, part-to-part comparison, tooling validation, and first article inspection.
Let Our Experts Help
Whether you need timely inspections, would like an estimate, or have an emergency and need help right away, we are here for you.
Call us at
470-552-8301
or complete the form below, and we will be in touch within 24 hours.
Story-Worthy Service, Rapid Response.
This is especially useful for organic and complex shapes where traditional CMM inspection may lack coverage and point density.
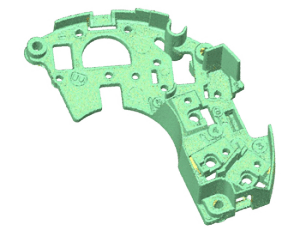
Scanning
Processing
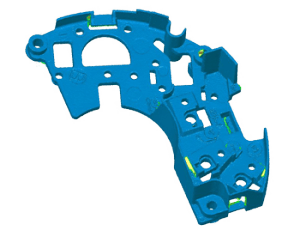
Alignment
Processing
Flexible Delivery. Powerful Reports
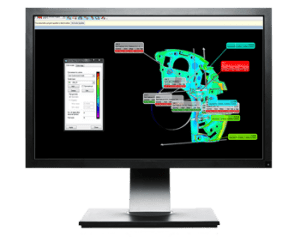
The output of every Deviation Analysis project includes a interactive 3D report, and a powerful viewer app called IMView. The deviation between the base and scan data can be represented in any way that is useful to you - Pass/Fail, color scales with custom range, etc. This viewer/report deliverable provides the ability for you to further interrogate the data and create custom reports in the future. Specific dimensional call outs can be taken from this report and published as a FAI data spreadsheet. This hybrid deliverable is called a CAV Plus.
Deviation Analysis is used as a final proof-of-work at the end of every Reverse Engineering project to demonstrate a precise point-by-point comparison that what we have created matches your physical part as scanned. This level of precision in verification is virtually impossible with manual methods. A Deviation Analysis makes full verification cost-effective and is critical to assure accuracy of the resulting model.
